Brent oil price in current euros from 1990

Oil, gas, coal, nuclear (PWR, EPR, hot fusion, ITER), gas and coal thermal power plants, cogeneration, tri-generation. Peakoil, depletion, economics, technologies and geopolitical strategies. Prices, pollution, economic and social costs ...
Christophe
Moderator
Moderator
posts: 79353
Registration: 10/02/03, 14:06
Location: Greenhouse planet
x 11059

Brent oil price in current euros from 1990


by Christophe » 16/11/08, 15:51

Here is the quotation of Brent oil in current euros since 1990 and until November 16, 2008 (today what!) The fall following the crisis is impressive ... how far will it go?

Image

This subject follows this article: https://www.econologie.com/l-argent-du-p ... -3297.html
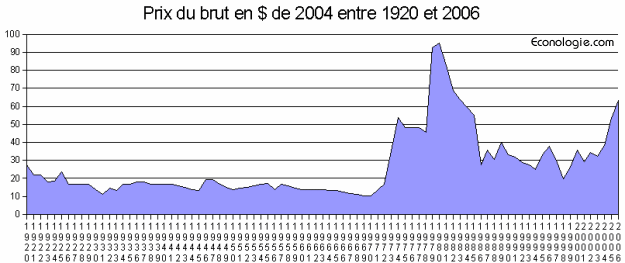
and on this subject dating from 2006 with figures from 2004 and therefore a bit outdated: https://www.econologie.com/forums/heures-de- ... t2786.html

Oil has never been so expensive, 90 € than last July, that is to say a few weeks before the crash ... was it a "test" on the part of traders? Nothing is less sure...

I mean by "test": see how far the population and the "system" accept an increase in the price of energy without failing ... uh shit ... come to think of it: what if it was this "test "who had catalyzed the crisis (since there was a fundamental crisis anyway)?

The following?

I will now correct this curve by inflation since 1990, then, even further, relate it to the hourly minimum wage then, if possible, compare it the price of oil to the evolution of the price of bread (if I get there we have some figures but nothing very specific ... thank you Maloche!) to get a very real idea of ​​the price of oil compared to the cost of living.

This curve comes from these 2 curves (simple multiplication):

a) Crude quotation in $:
Image
b) Parity $ / € since 1990:
Image
0 x
User avatar
Gregconstruct
Econologue expert
Econologue expert
posts: 1781
Registration: 07/11/07, 19:55
Location: Amay Belgium


by Gregconstruct » 16/11/08, 16:05

Well, there is like a link it looks like ...
0 x
Every action counts for our planet !!!
Christophe
Moderator
Moderator
posts: 79353
Registration: 10/02/03, 14:06
Location: Greenhouse planet
x 11059


by Christophe » 16/11/08, 16:14

Uh a link to what? The peak of oil and the crisis or the crisis and oil?

In the first case, I don't know (although the average time between quotation and consumption of 1 weeks fits PERFECTLY !!) but there is clearly a link between the current fall in crude oil and the crisis ...

Lowering the price of oil is a way (of help?) To revive industry and growth ... and at the rate where it falls is that the crisis is severe ...

An interesting graph would be to make the derivative of the price of crude! I will do as soon as I have corrected by inflation ...

Now an economic crisis is above all a lack of consumer confidence ... and the media which is currently destroying consumer confidence are largely responsible for it ... even if they will never admit it! https://www.econologie.com/forums/c-est-quoi ... t6413.html
0 x
User avatar
Remundo
Moderator
Moderator
posts: 16166
Registration: 15/10/07, 16:05
Location: Clermont Ferrand
x 5259


by Remundo » 16/11/08, 16:19

Hi, you just have to finish with the number of hours of minimum wage to buy a barrel ...

Right now, it should be low enough, maybe never so low ...

But it will not last, as soon as the crisis fades, the oil will flare up, it is structural (increase in demand + scarcity of supply)
0 x
Image
User avatar
Gregconstruct
Econologue expert
Econologue expert
posts: 1781
Registration: 07/11/07, 19:55
Location: Amay Belgium


by Gregconstruct » 16/11/08, 16:21

I firmly believe that everything is linked.
Take it in any direction, there is always a link ...
0 x
Every action counts for our planet !!!
Christophe
Moderator
Moderator
posts: 79353
Registration: 10/02/03, 14:06
Location: Greenhouse planet
x 11059


by Christophe » 16/11/08, 16:30

Remundo wrote:Hi, you just have to finish with the number of hours of minimum wage to buy a barrel ...


Already done in 2006: https://www.econologie.com/forums/heures-de- ... t2786.html

Problem if I want to go back to 1980, on this page http://www.industrie.gouv.fr/energie/pe ... _brent.htm it stopped in 1990 and I don't remember how and with what data I drew the curve in 2006 :(

Ah maybe with this one:

Image
itself from: https://www.econologie.com/le-vrai-prix- ... s-479.html
(I had measured "by eye" I think) but it is much less precise (years instead of months :( )

If kk1 therefore manages to find a table month by month (as on gouv.fr) of the price of oil before 90 it will help me a lot! Gregouuuuuuuneeeeeeeet?
Last edited by Christophe the 16 / 11 / 08, 16: 39, 1 edited once.
0 x
User avatar
Gregconstruct
Econologue expert
Econologue expert
posts: 1781
Registration: 07/11/07, 19:55
Location: Amay Belgium


by Gregconstruct » 16/11/08, 16:32

Ooooouuuuuuuuuuiiiiiiiiiiiiiii ???
0 x
Every action counts for our planet !!!
Christophe
Moderator
Moderator
posts: 79353
Registration: 10/02/03, 14:06
Location: Greenhouse planet
x 11059


by Christophe » 16/11/08, 16:57

Well look !! :)
It takes: price of brent before 1990 month by month :)
0 x
Leo Maximus
Econologue expert
Econologue expert
posts: 2183
Registration: 07/11/06, 13:18
x 124


by Leo Maximus » 16/11/08, 19:29

AMHA, you should see the archives on the Echos website. In this daily there is a "Raw materials" page where there are all the prices, Brent, uranium, but also that of orange juice or pork carcass (I'm not kidding!) : Lol: . I only keep the old issues for a few months and then I recycle them after cutting out the interesting articles. Sorry.
About the price of gasoline I keep my notes and my receipts : Lol: and I can say that the super leaded cost me for example 4,66 francs in summer 1981 at Shell in town. By reporting this to the hourly minimum wage it would be today in the 2,5 € ~ 2,6 € per liter!
0 x
Christophe
Moderator
Moderator
posts: 79353
Registration: 10/02/03, 14:06
Location: Greenhouse planet
x 11059


by Christophe » 16/11/08, 20:48

For the crude we found, I will use these curves: http://www.wtrg.com/prices.htm

For gasoline or other fuel oil, you can use the Pégase network: http://www.industrie.gouv.fr/energie/st ... pegase.php

I had already used it to draw some curves (it exports in .xls or .csv) about the evolution of taxes on diesel, but it is (almost) another debate that!
0 x


  • Similar topics
    Replies
    views
    Last message

Go back to "Fossil energies: oil, gas, coal and nuclear electricity (fission and fusion)"

Who is online ?

Users browsing this forum : A.D. 44 and 333 guests