Stock exchange: 3 graphs to measure the violence of the correction
Thousands of billions of dollars gone up in smoke, historic records of decline, the index of fear that flies away ... Here are the crazy figures that marked the dropping out of Wall Street.
1.000 billion financial value erased
As a percentage, it does not look like much, but converted into market capitalization, the fall of Wall Street takes on another aspect. “Call it Black Monday Act II, call it the Dow which behaves like bitcoin. The facts are that the S&P 500 has lost over $ 1.000 billion in market capitalization in one month, ”comments Naeem Aslam, at Think Markets. According to Bloomberg data, the index was valued at $ 25.000 trillion at the end of January. Tuesday, Wall Street rebounds: the main US indices are up.
The greatest number of points lost
This is the biggest drop in Dow Jones points in its history. The biggest declines date back to the financial crisis. On September 29, 2008, he dropped 777,68 points. On October 15, 2008, the day after the Lehman Brothers bankruptcy, he had surrendered 733,08 points. It must be said that since the low point in March 2009, the Dow Jones has gone from 7.600 points to a record of 26.619 points. It is therefore the first time that the Dow has fallen by more than 1.000 points in one session.
The biggest daily drops in Dow Jones points. - (c) Bloomberg / Etienne Goetz
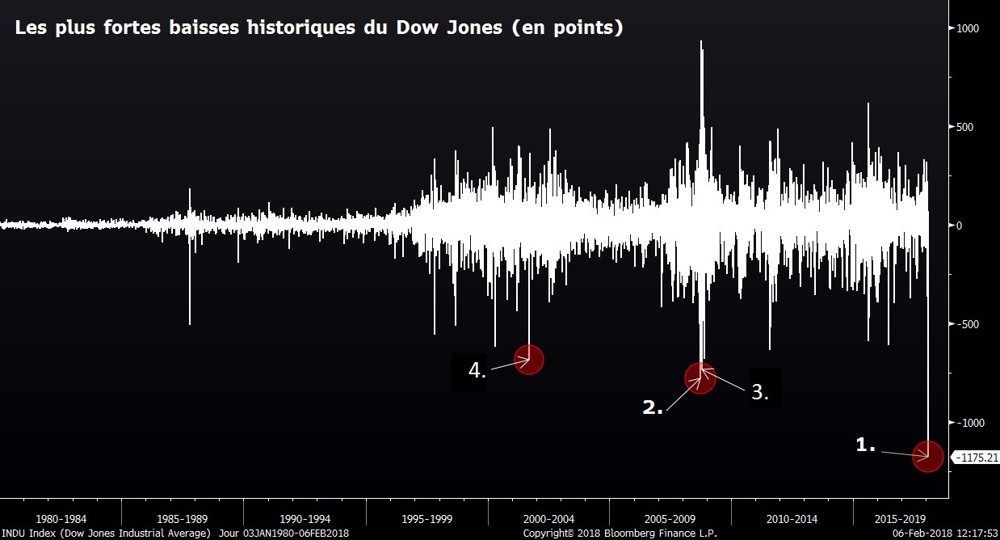
- 1.jpg (78.33 KB) Viewed times 2070
More than 400 days without correction
Unheard of since the 1950s. The S&P 500 spent 404 sessions without experiencing a correction greater than 5%. US markets have bet on higher corporate income thanks to Trump's tax reform and bank deregulation. Since the election of the businessman, the S&P 500 had gained more than 30%.
The VVix measures the volatility of the Vix. - (c) Bloomberg / Etienne Goetz
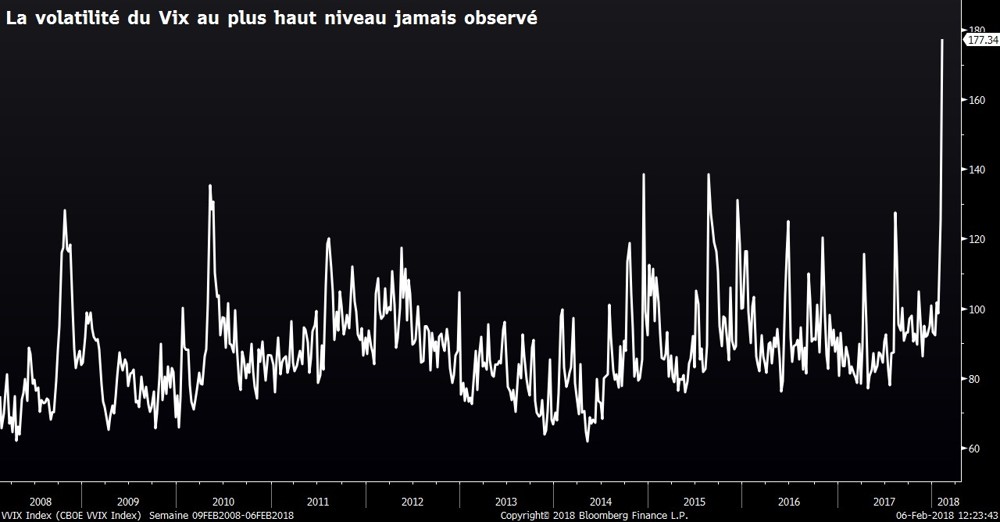
- 2.jpg (69.16 KB) Viewed times 2070
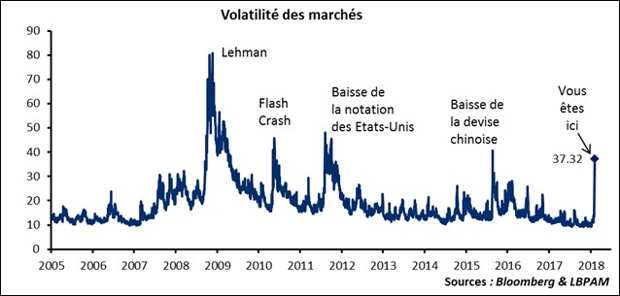
Fear index explodes
The volatility index, the Vix, also known as the “fear index”, has never jumped so much at once. On Monday, it gained + 116% to 37,32. It is its highest increase in session, even if it is not at the highest in its history. In fact, the Vix volatility index is at its highest level ever observed. On Tuesday, the Vix continued to climb until it crossed the 50 mark. Index funds that bet on the fall in volatility are in full swing and have trapped speculators.
- 3.jpg (22.43 KB) Viewed times 2070


